
Analyzing Corporate Debt and Balance Sheet Health Before Buying Stocks
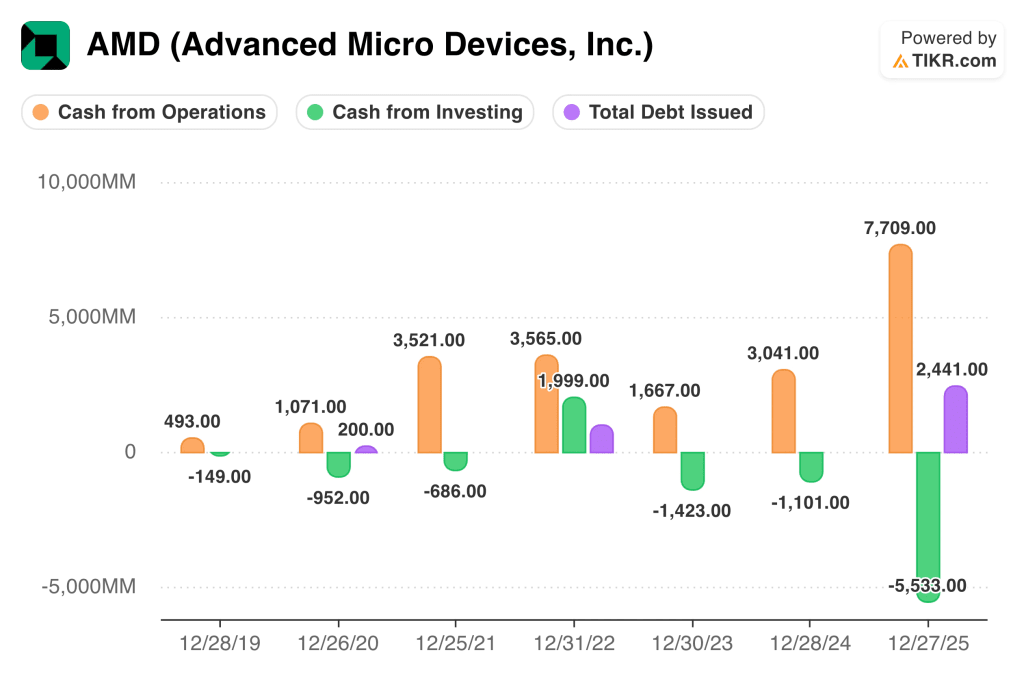
When considering investing in stocks, one of the most critical aspects to evaluate is a company's financial health, particularly its corporate debt and balance sheet. Understanding these elements can help investors make informed decisions, mitigate risks, and identify potential opportunities. In this article, we will explore the significance of analyzing corporate debt and balance sheet health, the key metrics to consider, and how to interpret this data effectively.
The Importance of Corporate Debt
Corporate debt refers to the borrowed funds that a company uses to finance its operations and growth. While taking on debt is a common practice, excessive debt can lead to financial distress. Here are a few reasons why analyzing corporate debt is essential:
- Leverage and Risk: Companies often use debt to leverage their operations. While this can amplify returns during profitable times, it also increases the risk during downturns. High leverage can lead to severe consequences if the company faces unexpected challenges.
- Interest Obligations: Debt comes with interest payments that companies must meet regardless of their profitability. Understanding a company's ability to service its debt is crucial for assessing financial stability.
- Market Perception: Investors and analysts often scrutinize a company's debt levels as part of their overall evaluation. High debt can lead to negative perceptions and impact stock prices.
Key Metrics for Analyzing Debt
To assess corporate debt effectively, investors should focus on several key metrics:
1. Debt-to-Equity Ratio
The debt-to-equity (D/E) ratio compares a company's total liabilities to its shareholder equity. A high D/E ratio indicates that a company is primarily financed through debt, while a lower ratio suggests a more conservative approach to financing. Generally, a D/E ratio above 1.0 is seen as high, but acceptable levels can vary by industry.
2. Interest Coverage Ratio
The interest coverage ratio measures a company's ability to pay interest on its outstanding debt. It is calculated by dividing earnings before interest and taxes (EBIT) by interest expenses. A ratio below 1.0 means that the company does not generate enough income to cover its interest payments, signaling potential financial trouble.
3. Total Debt to EBITDA
This ratio indicates how many years it would take for a company to pay off its debt if it devoted all its earnings before interest, taxes, depreciation, and amortization (EBITDA) to debt repayment. A lower ratio suggests that the company is in a better position to handle its debt burdens.
Understanding Balance Sheet Health
The balance sheet is a snapshot of a company’s financial position at a specific point in time. Analyzing balance sheet health provides insights into a company's assets, liabilities, and equity, which are crucial for understanding its overall stability and growth potential.
1. Current Ratio
The current ratio measures a company's ability to cover its short-term obligations with its short-term assets. It is calculated by dividing current assets by current liabilities. A current ratio above 1.0 indicates that the company can meet its short-term liabilities, while a ratio below 1.0 may signal liquidity issues.
2. Quick Ratio
Also known as the acid-test ratio, the quick ratio is a stricter measure of liquidity as it excludes inventory from current assets. It is calculated by dividing liquid assets by current liabilities. A quick ratio greater than 1.0 is generally considered healthy, indicating that a company can quickly convert its assets to cash to meet its obligations.
3. Return on Equity (ROE)
Return on equity measures how effectively a company is using shareholders' equity to generate profits. A higher ROE indicates efficient management and strong performance. It's essential to compare ROE with industry peers to gauge a company's relative performance.
Interpreting the Data
After gathering and calculating the relevant metrics, it's crucial to interpret the data in context. Here are some tips for making sense of the numbers:
- Industry Comparisons: Always compare debt and balance sheet metrics with industry averages. Different industries have varying norms for debt levels and financial health.
- Historical Trends: Analyze the company's historical data to identify trends in debt levels and balance sheet health over time. A sudden increase in debt or a decline in liquidity ratios may raise red flags.
- Economic Conditions: Consider the broader economic environment. In times of economic growth, companies may manage higher debt levels more effectively than during recessions.
Conclusion
Analyzing corporate debt and balance sheet health is a vital part of making informed investment decisions. By understanding the implications of debt levels and evaluating key financial metrics, investors can assess a company's risk and potential for growth. Remember, a thorough analysis should include comparisons with industry benchmarks and consideration of economic conditions. By taking these factors into account, investors can position themselves for success in the stock market.
Si quieres conocer otros artículos parecidos a Analyzing Corporate Debt and Balance Sheet Health Before Buying Stocks puedes visitar la categoría Market Psychology & Advanced Analysis.
Related posts