
How to Analyze Quarterly Earnings Reports Like a Wall Street Analyst
Quarterly earnings reports serve as a critical window into a company's financial health and future prospects. For investors and analysts alike, these reports can provide invaluable insights that guide investment decisions. Understanding how to analyze these reports effectively can empower you to make informed choices about your investments. This article will equip you with the tools and methods used by Wall Street analysts to dissect quarterly earnings reports.
Understanding the Structure of Earnings Reports
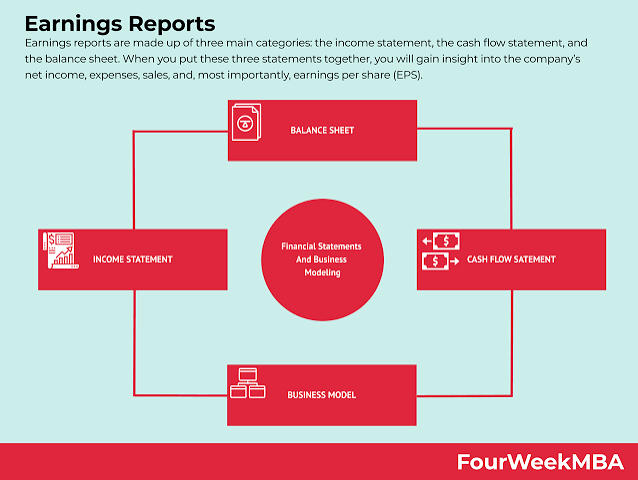
Before diving into the analysis, it is essential to familiarize yourself with the common components of quarterly earnings reports. Generally, these reports include:
- Income Statement: This outlines the company's revenues, expenses, and profits over the quarter.
- Balance Sheet: This provides a snapshot of the company's assets, liabilities, and equity at the end of the quarter.
- Cash Flow Statement: This details how cash is generated and used in operational, investing, and financing activities.
- Management Discussion and Analysis (MD&A): This section allows management to discuss the results and provide insights into future expectations.
- Guidance: Many companies offer forecasts for future earnings and growth, which can significantly influence stock price movements.
Key Metrics to Evaluate
Once you have a grasp on the structure of the report, focus on specific metrics that analysts prioritize. Here are some critical areas to evaluate:
EPS is a fundamental measure of a company's profitability. It is calculated by dividing the net income by the total outstanding shares. Analysts compare the reported EPS to the consensus estimates to gauge performance. A positive surprise can indicate a strong performance, while a negative surprise may raise red flags.
2. Revenue Growth
Revenue growth indicates how well a company is expanding its business. Look for both year-over-year and quarter-over-quarter growth to assess trends. A company consistently growing its revenues often signals a competitive advantage and market acceptance.
3. Operating Margin
The operating margin reflects the efficiency of a company in managing its core business operations. It is calculated by dividing operating income by total revenue. A higher operating margin suggests better cost control and pricing power, which can be advantageous in competitive markets.
4. Guidance and Future Outlook
Management's guidance on future earnings and growth rates plays a vital role in stock valuation. Wall Street analysts often adjust their models based on this guidance. Pay attention to any changes in outlook, as they can lead to stock price volatility.
Comparative Analysis
To contextualize a company's performance, it is essential to compare its metrics with industry peers. This comparative analysis can reveal whether a company is outperforming or underperforming its competitors. Look for:
- Peer Group Comparison: Compare key metrics like EPS, revenue growth, and margins with similar companies in the industry.
- Historical Performance: Evaluate how current results stack up against the company’s historical performance over previous quarters and years.
Qualitative Factors to Consider
Beyond the numbers, qualitative factors can significantly impact a company's future performance. Analysts consider various elements, such as:
1. Management Commentary
The tone and content of management's commentary in the MD&A section can provide insights into the company's confidence and strategic direction. Look for mentions of new products, market expansion, and potential risks.
2. Market Conditions
Understanding the broader economic environment is crucial. Factors like interest rates, inflation, and consumer behavior can influence a company's performance. Analysts often consider these macroeconomic indicators when forming their views.
3. Competitive Landscape
Evaluate how competitive dynamics may affect the company. Are there new entrants in the market? How is the company positioned against its competitors? An understanding of the competitive landscape can help anticipate future challenges or opportunities.
Utilizing Financial Ratios
Financial ratios are essential tools for assessing a company's performance and financial health. Here are a few key ratios to consider:
- Price-to-Earnings (P/E) Ratio: This ratio compares the company's current share price to its EPS, providing insight into valuation relative to earnings.
- Debt-to-Equity (D/E) Ratio: This measures a company's financial leverage by comparing total liabilities to shareholders' equity, indicating how much debt a company is using to finance its operations.
- Return on Equity (ROE): This ratio measures a company's profitability relative to shareholders' equity, showing how effectively management is using equity to generate profits.
Conclusion
Analyzing quarterly earnings reports like a Wall Street analyst involves a blend of quantitative and qualitative evaluation. By mastering the key metrics, understanding the structure of earnings reports, and considering both comparative and qualitative factors, you will be better equipped to make informed investment decisions. Remember, thorough analysis not only helps you identify potential investment opportunities but also enhances your understanding of the market dynamics at play. Stay curious and continue learning to refine your investment strategies over time.
Si quieres conocer otros artículos parecidos a How to Analyze Quarterly Earnings Reports Like a Wall Street Analyst puedes visitar la categoría Stock Market & Investing Strategies.
Related posts