
How to Read Stock Charts and Identify Key Technical Indicators
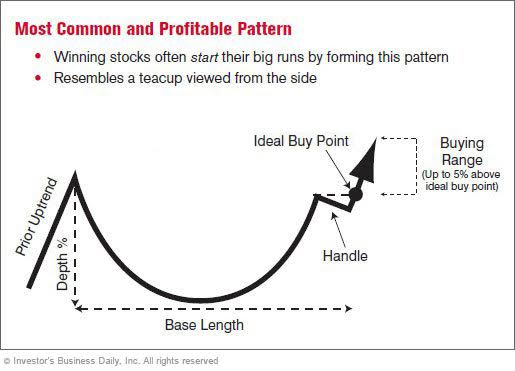
Understanding stock charts is crucial for any investor looking to make informed decisions in the stock market. These visual representations of price movements can provide insights into market trends, potential reversals, and the overall health of an asset. In this article, we will delve into how to read stock charts and identify key technical indicators that can enhance your investing strategies.
Understanding Stock Charts
Stock charts display historical price data for a security over a specified period. They can take various forms, including line charts, bar charts, and candlestick charts. Each type has its own advantages and can be used to glean different insights.
Types of Stock Charts
- Line Charts: These charts use a single line to connect closing prices over time, providing a clear visual of the stock's movement. They are great for identifying overall trends but lack detail on price fluctuations within the period.
- Bar Charts: Bar charts show the open, high, low, and closing prices for a given period, represented by vertical bars. This format allows for a more comprehensive view of price action and volatility.
- Candlestick Charts: Similar to bar charts, candlestick charts depict open, high, low, and closing prices, but they do so with colored ""candles"" that indicate price movement direction. Green (or white) candles represent price increases, while red (or black) candles indicate price decreases. This format helps traders quickly identify market sentiment.
Key Components of Stock Charts
When analyzing stock charts, several key components should be considered to better understand price movements and make informed decisions.
Time Frame
The time frame of the chart is critical. Charts can display data from as short as one minute to as long as several years. Short-term charts (like 1-minute or 5-minute) are often used for day trading, while long-term charts (like weekly or monthly) are better suited for investors looking at broader trends.
Volume
Volume refers to the number of shares traded during a specific period. It is typically displayed as a histogram at the bottom of the chart. High volume can indicate strong interest in a stock, either bullish or bearish, while low volume may suggest a lack of conviction in price movements.
Identifying Key Technical Indicators
Technical indicators are mathematical calculations based on price and volume, helping investors identify potential price movements. Here are some of the most widely used indicators:
Moving Averages
Moving averages smooth out price data to identify trends over a specific period. The two most common types are:
- SMA (Simple Moving Average): This is the average price over a set number of periods. For example, a 50-day SMA averages the closing prices of the last 50 days.
- EMA (Exponential Moving Average): This gives more weight to recent prices, making it more responsive to new information. It is particularly useful for identifying short-term trends.
Relative Strength Index (RSI)
The RSI is a momentum oscillator that measures the speed and change of price movements. It ranges from 0 to 100 and is typically used to identify overbought or oversold conditions. An RSI above 70 may indicate that a stock is overbought (potentially due for a correction), while an RSI below 30 may suggest it is oversold (potentially due for a rebound).
MACD (Moving Average Convergence Divergence)
The MACD is a trend-following momentum indicator that shows the relationship between two moving averages of a stock's price. Traders often look for crossovers between the MACD line and the signal line as potential buy or sell signals. When the MACD crosses above the signal line, it may indicate a bullish trend, while a crossover below may signal a bearish trend.
Putting It All Together
Reading stock charts and interpreting technical indicators can seem daunting at first, but with practice, it becomes easier. Here are some steps to effectively analyze stock charts:
- Choose the appropriate chart type and time frame based on your trading or investing strategy.
- Observe the overall trend—look for patterns and consider the direction of the price movement.
- Examine volume alongside price movements to gauge market interest and strength.
- Apply technical indicators like moving averages, RSI, and MACD to identify entry and exit points.
- Stay updated on broader market conditions and news that could impact stock performance.
Conclusion
Reading stock charts and understanding key technical indicators are essential skills for anyone interested in the stock market. By familiarizing yourself with different chart types, components, and indicators, you can develop a more strategic approach to investing. Remember, practice makes perfect, and the more you engage with stock charts, the better your analysis will become over time.
Si quieres conocer otros artículos parecidos a How to Read Stock Charts and Identify Key Technical Indicators puedes visitar la categoría Stock Market & Investing Strategies.
Related posts