
The Yield Curve Inversion: Is It Still a Reliable Recession Indicator?
The yield curve has long been a critical tool for economists and investors alike, serving as a barometer for economic health and potential recessions. When short-term interest rates exceed long-term rates, a phenomenon known as a yield curve inversion occurs, signaling investor pessimism about future economic conditions. But with evolving market dynamics, the question arises: Is the yield curve inversion still a reliable recession indicator? In this article, we will explore the mechanics of the yield curve, historical performance, and the current economic landscape to assess its validity today.
Understanding the Yield Curve
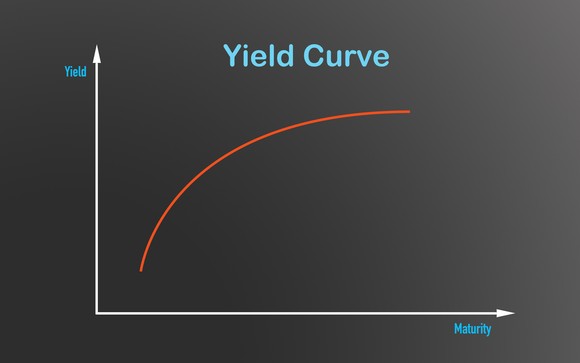
The yield curve is a graphical representation of interest rates on debt for a range of maturities. Typically, it slopes upward, reflecting the fact that longer-term debt instruments usually have higher yields than short-term ones. This upward slope is based on the expectation that investors demand more return for locking up their money for an extended period.
However, when the yield curve inverts, it indicates that short-term interest rates are higher than long-term rates. This inversion can suggest that investors expect a slowdown in economic growth, leading to lower inflation and interest rates in the future. The yield curve is often segmented into three types:
- Normal Yield Curve: Long-term rates are higher than short-term rates.
- Inverted Yield Curve: Short-term rates exceed long-term rates.
- Flat Yield Curve: Short and long-term rates are very close to each other.
Historical Context of Yield Curve Inversions
Historically, yield curve inversions have been reliable indicators of impending recessions. For example, in the years leading up to the 2001 and 2008 recessions, the yield curve inverted several months before the economic downturns. This track record has led many economists and analysts to rely on the yield curve as a forecasting tool.
Research shows that, on average, a yield curve inversion has preceded U.S. recessions by about 6 to 24 months. However, it is essential to consider that not every inversion leads to a recession, and the context surrounding each instance can vary significantly.
Recent Trends and Economic Factors
In recent years, the dynamics of the yield curve and its implications have become more complex. Several factors have contributed to this complexity:
- Global Economic Conditions: The interconnectedness of global economies means that external factors, such as geopolitical tensions or foreign monetary policies, can influence domestic interest rates and the yield curve.
- Monetary Policy: Central banks, including the Federal Reserve, have engaged in unconventional monetary policies, such as quantitative easing, which can distort traditional yield curve signals.
- Market Sentiment: Investor behavior and sentiment can also impact yield curves. For instance, if investors flock to long-term bonds for safety, this demand can lower long-term yields, leading to an inversion even in a stable economic environment.
Is the Yield Curve Still a Reliable Indicator?
While the yield curve remains a vital economic indicator, its reliability as a recession predictor is under scrutiny. Recent yield curve inversions have not always aligned with subsequent economic downturns, leading to questions about their predictive power in the current environment.
Several economists argue that the current economic landscape, characterized by unprecedented monetary policy interventions and global uncertainties, may challenge the traditional interpretation of yield curve inversions. For example:
- Delayed Recession Signals: Some argue that the effects of yield curve inversions may take longer to materialize in today's economy due to structural changes and government interventions.
- Alternative Indicators: Other economic indicators, such as unemployment rates, consumer spending, and corporate earnings, may provide additional context and should be considered alongside yield curve analysis.
Conclusion
The yield curve inversion has a storied history as a recession indicator, but its reliability in the current economic climate is not as clear-cut. While it remains a valuable tool for understanding market sentiment and economic expectations, it is essential to consider the broader context and additional indicators when assessing economic health.
Investors and policymakers should approach yield curve analysis with caution, recognizing that while historical trends provide valuable insights, they do not guarantee future outcomes. As the economy continues to evolve, so too must our understanding of the yield curve and its implications for recession forecasting.
Si quieres conocer otros artículos parecidos a The Yield Curve Inversion: Is It Still a Reliable Recession Indicator? puedes visitar la categoría Macroeconomics & Federal Reserve Policy.
Related posts